Zero Trust Runs on Relationships. Security Graphs Make Them Visible.

Director of Indstry Solutions
In 1736, Swiss mathematician Leonhard Euler studied a puzzle about seven bridges in the city of Königsberg.
The question seemed simple: could you cross each bridge once without retracing your steps?
Euler reframed the problem. He stopped looking at streets and geography and instead mapped land masses as nodes and bridges as edges. By modeling relationships instead of physical space, he proved the puzzle couldn’t be solved. In doing so, he founded graph theory.
That shift in thinking matters more today than ever.
Modern digital environments aren’t defined by servers or IP addresses but by relationships. It’s crucial to know information such as which identities access which workloads, which services communicate with each other, and which cloud roles trust which accounts.
A security graph models that reality directly. It represents users, devices, applications, and data as nodes, and their connections as edges.
Zero Trust operates on the same premise. It’s built on understanding and controlling relationships across the environment.
When you treat Zero Trust as a graph problem, you move faster, enforce policy with greater precision, and reduce blast radius in measurable ways.
Zero Trust is a relationship model
Zero Trust is often summarized by a few core principles: assume breach, enforce least-privilege access, and continuously verify.
Those principles are widely understood. But what’s more difficult is operationalizing them at scale.
Every Zero Trust decision depends on context:
- Who is requesting access
- From which device
- To which workload
- Under what conditions
- Across which trust boundaries
Most organizations have the telemetry, but what they lack is cohesion.
Their identity tools see identities, network tools see flows, and cloud tools see configurations. Each system provides a partial view. Security teams are left stitching together fragments during audits or incidents.
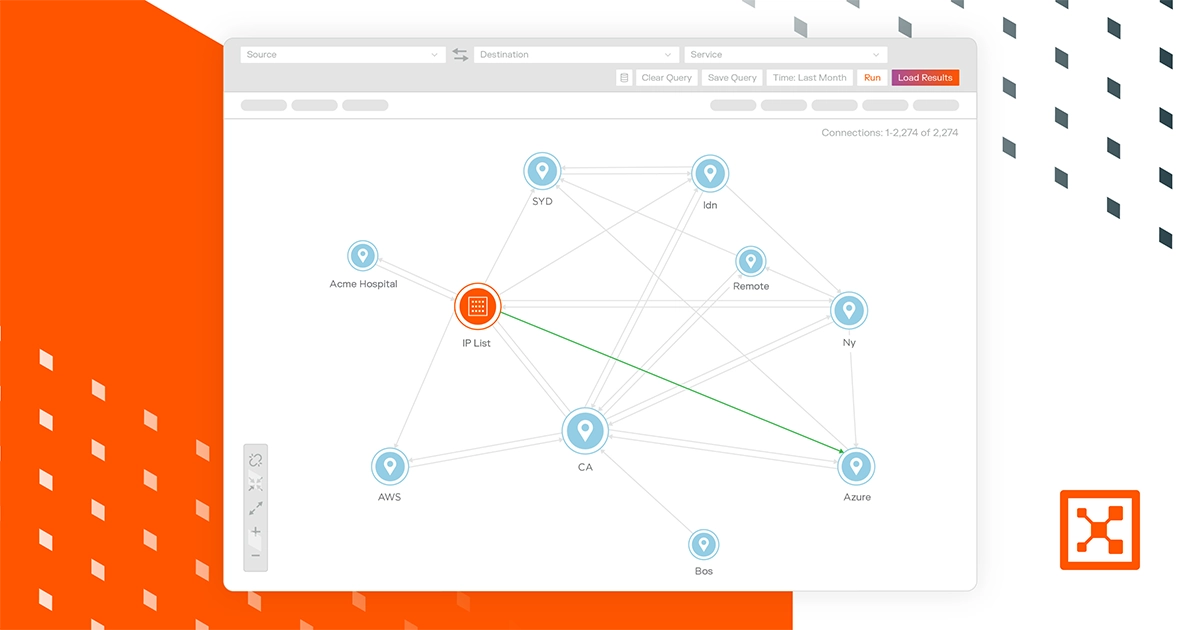
A security graph unifies those fragments into a living model. Instead of asking multiple tools separate questions, you query the environment itself:
- What paths exist from internet-facing workloads to critical data stores?
- Which identities bridge finance and engineering domains?
- If this workload is compromised, what else becomes reachable?
These are Zero Trust questions, and they’re also graph queries.
When Zero Trust programs stall, it’s often because teams lack a clear map of trust relationships. Graphs make those relationships explicit.
Turning “assume breach” into measurable containment
Assume breach is a starting point. Containment is the goal.
If you assume compromise, you need to know how far an attacker could move before your security controls stop them. That requires visibility into lateral pathways across the environment.
Graph analysis exposes those pathways directly. Attack path modeling shows how vulnerabilities, privileges, and connectivity combine to reach high-value systems.
Instead of prioritizing issues individually, you can evaluate them based on their position in the graph.
A medium-severity vulnerability connected to a critical database may represent more risk than a critical flaw isolated in a low-impact system. The graph makes that visible instantly.
This reframes Zero Trust from a philosophical stance to a measurable reduction in reachable assets. It allows you to quantify the blast radius, demonstrate segmentation effectiveness, and show progress in concrete terms.
That clarity accelerates executive alignment and reduces friction across teams.
Aligning Zero Trust with business reality
Zero Trust is often perceived as complex and disruptive. In large enterprises, it’s often a multi-year transformation.
Security graphs help simplify the journey.
By unifying identity, network, cloud, and workload data into one relational model, they provide a shared operational view.
During incidents, that view shows how activity propagates. During compliance reviews, it demonstrates segmentation and data flow control. During architecture planning, it reveals concentrations of systemic risk.
Teams make better decisions when they see how everything connects. Zero Trust moves faster when everyone works from the same map.
Attackers already think in graphs
Attackers don’t see your environment as separate tools and dashboards. Instead, they see nodes and pathways, just as Euler saw the city of Königsberg.
Once inside, they ask a simple question. What can I reach next?
They follow relationships, map connectivity, and look for trust edges that extend their access. If defenders rely on siloed visibility, they’re responding to fragments of a larger picture.
Zero Trust demands a connected view of the environment. Security graphs provide that view.
Organizations that adopt graph-driven Zero Trust gain more than better visualization. They gain structural control over how access flows through their environment. They shorten the path to maturity and reduce the blast radius before incidents unfold.
The future of Zero Trust belongs to teams that understand their environment as a network of relationships and govern it accordingly.